“You can’t do proper CRM on Amazon.” You might hear this statement often. And it’s partially true. But to conclude from this that customer retention on Amazon is generally impossible would be a mistake. There’s a wealth of information hidden in the purchase data that Amazon makes available to you as a seller. You just need to know how to read it.
Why a Lack of CRM Is a Strategic Risk
In the classic e-commerce world, CRM is the backbone of profitability. On Amazon, however, most agencies and brands only optimize for ACOS or, at best, for Contribution Margin 3, which can be easily determined with the Valuezon Performance Cockpit.
The problem: These metrics are either too limited or measure only the result, not the root cause of success. They look only at the moment of purchase, but not the customer relationship before and after. If you have no understanding of customer retention, you are taking a big risk:
- Misallocation of budgets: You invest heavily in products that attract first-time buyers, but have an almost zero repurchase rate.
- Margin pressure: If you have to buy every sale again and again through expensive ad clicks, rising click prices will eat up your margin.
- Dependency on the algorithm: Without loyal repeat customers, you are extremely vulnerable to any change in Amazon’s ranking algorithm.
Real growth on Amazon only begins when you shift your focus from purely acquiring new customers to maximizing Customer Lifetime Value. The Valuezon Loyalty Tool makes exactly that possible.
The Basics: What the Tool Analyzes
The tool relies on the Order Reports from Amazon Seller Central. These can be retrieved retroactively for up to 18 months on your first attempt. That’s enough to identify initial, meaningful purchasing patterns. Those who keep adding new data over time will gradually gain a sharper picture of their customers.
It all starts with the question: Who are your customers, and how do they shop? Based on unique customer accounts, the tool calculates:
- How many different customers have ordered from you?
- How many of them have ordered more than once? (Repeat purchase rate)
- What is the average shopping cart value—and does it differ significantly between first and subsequent purchases?
- What is a customer’s average value across their entire purchase history? (Customer Lifetime Value)
- How often does a customer order on average, and how many days are there between two orders?

These figures sound simple. But most sellers don’t know them. Yet they form the basis for almost every strategic decision. The tool is divided into 5 analysis areas, each highlighting specific loyalty patterns and from which various customer retention measures on Amazon can be derived.

Subscribe to our newsletter and receive fresh updates every two weeks.
The 5 Areas of Analysis: Simply Explained
The Repeat Purchase Analysis: Who Comes Back and Why?
Here we take a closer look at how purchasing behavior changes with the number of orders. Do customers who order a second time buy more? Do they order more frequently? Does the gap between purchases get shorter or longer? Do shopping cart sizes get bigger or smaller over time?
This might sound like a detail—but it’s highly relevant. Because if you know that the second purchase is, on average, significantly larger than the first, it completely changes your perspective on new customer acquisition.
Side effect: Recognizing arbitrage dropshippers. If a customer orders 15 or 20 times within a few months, that’s often not a sign of extreme loyalty, but a warning signal. Such patterns often indicate so-called arbitrage dropshippers: Operators who sell your products at inflated prices on other platforms and fulfill directly from your Amazon FBA inventory to their own customers—all without your knowledge. The tool makes these irregular purchasing patterns visible. Using the corresponding order numbers, you can investigate further in Seller Central and, depending on the situation, initiate legal steps—like for image rights violations.
The Basket Analysis: What Do Your Customers Buy Together?
In the “Brand Analytics” section, Amazon itself shows you with the “Basket Analysis” which products are frequently bought together in a single purchase. What the tool adds: It doesn’t just look at individual transactions, but analyzes combination effects across the entire purchase history of a customer.
Meaning: Which products does someone who bought this particular product first go on to buy throughout their customer relationship with your brand? This opens up completely new possibilities. For example, ideal use cases or specific customer segments can be derived from their buying behavior.
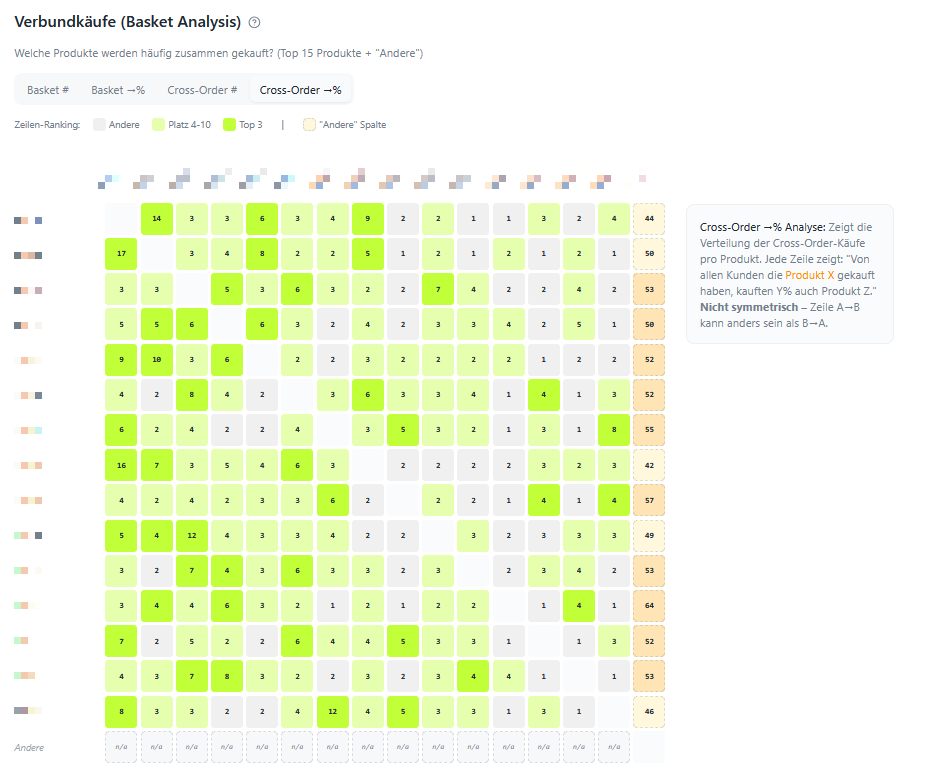
Example: In the dietary supplements sector, a strong bundle purchase effect can be observed, for instance, between Vitamin D3/K2, C, and Zinc. A classic immune system assortment. Those who know this can specifically develop bundles, place cross-selling content on the product pages, or design combined promotional campaigns.
The analysis of loyalty cohorts: what distinguishes loyal customers from one-time buyers?
Here, customers are segmented according to their purchase frequency and compared to each other. Do customers who have ordered three times or more have a higher average basket value? Do they buy more products per order? Do they cover a broader range of the brand’s assortment?

This analysis shows whether and how particularly loyal customers concretely differ from others. And whether there are certain products that especially loyal customers buy disproportionately often.
The product cohort analysis: which product makes customers especially loyal?
This is one of the most intriguing questions the tool can answer: Which “entry product” generates the most loyal customers?
The result surprises many sellers: the bestseller is not automatically the product that wins the most loyal customers. Often, it’s a niche product that at first glance appears to have less volume, but addresses a specific use case and therefore attracts customers with a noticeably higher customer lifetime value.

We call these products anchor products. Those who are aware of them and understand their customer retention effect can invest significantly more in marketing there. Because you’re not just creating a sale, you’re gaining a long-term valuable customer.
The customer journey analysis: how do customers move through your assortment?
The final analysis visualizes your customers’ purchase paths. It’s similar to a click path analysis in Google Analytics, but for purchase actions instead of page views.
You can see: Which product did customers start with? What did they buy next? What did they buy last – or after which purchase does the customer relationship possibly end?

This is especially valuable for assortment development as well as for targeted marketing of certain products (keyword: AMC Audiences). If you recognize what customers are searching for after a specific initial purchase and can’t yet find from you, you’ll know which product would make sense to introduce next.
Amazon data is worth more than most people think
No email for direct contact. That remains a real limitation on Amazon. But the data Amazon provides you as a seller contains more information about your customers’ purchasing behavior than most people realize. You just have to read it the right way.
The Valuezon Loyalty Tool translates raw order data into concrete insights. About repeat customers, product performance, cross-selling potential, and the customer journey through your assortment.
And a nice side effect: What you learn about buying behavior on Amazon can often be directly transferred to other channels—even where the data situation is thinner than on Amazon.